Back to: ZOOLOGY 500 Level
Welcome to class!
Hello there, my ever-curious Zoology star! I’m glad to have you back for another exciting and knowledge-packed session. Today, we’re learning something very powerful in the world of ecology and biodiversity research: species richness, species evenness, and how to measure biodiversity using Simpson’s Index and Shannon Index. These concepts are not just mathematical; they are practical tools that help us understand how healthy, diverse, and balanced an ecosystem is—whether it’s a forest in Cross River or a freshwater wetland in Bayelsa.
Species Richness, Evenness, Simpson’s And Shannon Indices
Species Richness
Species richness simply refers to the number of different species present in a given area. The more species you find, the richer that ecosystem is considered. For example, if you survey a forest and find 12 different bird species, the species richness is 12.
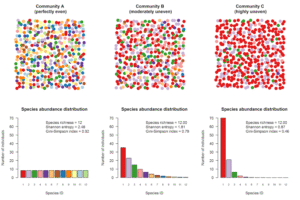
However, richness alone doesn’t tell the full story. Imagine two ecosystems both with five species—but in one, one species dominates heavily. That brings us to evenness.
Species Evenness
Species evenness refers to how evenly individuals are distributed across the different species in a community. If all species have similar population sizes, the ecosystem has high evenness. If one or two species dominate while others are very few, evenness is low.
For instance, in a Lagos lagoon, if you observe ten species of fish and each species has around 100 individuals, that’s high evenness. But if one species has 800 individuals and the others just a few, the ecosystem is unbalanced.
Why These Metrics Matter
Biodiversity isn’t just about how many species live in an area. It’s also about balance, interaction, and stability. An ecosystem with both high richness and evenness is usually more resilient to disturbances like pollution or climate change.
Simpson’s Index (D)
Simpson’s Index measures the probability that two individuals randomly selected from a sample belong to the same species. It’s more sensitive to dominant species.
The formula is:
D = Σ (n/N)²
Where:
n = the number of individuals in a species
N = total number of all individuals
Σ means you sum it over all species
To get Simpson’s Diversity Index, we often use:
1 – D (the closer to 1, the more diverse the community).
Shannon Index (H’)
The Shannon Index considers both richness and evenness and is more influenced by rare species than Simpson’s.
The formula is:
H’ = – Σ (pi × ln pi)
Where:
pi = proportion of individuals in species i (n/N)
ln = natural logarithm
The higher the value of H’, the higher the biodiversity. This is especially useful in comparing two habitats side-by-side.
Example from Nigeria
A group of university students studying two wetlands—one near a busy urban area and another in a remote, undisturbed village—used Simpson’s and Shannon’s indices to compare them. Even though both had similar species richness, the remote site had higher evenness and therefore, higher biodiversity scores. This showed that human activity was reducing balance in the urban wetland.
Summary
- Species richness is the number of species present.
- Species evenness is the relative abundance of each species.
- Simpson’s Index emphasises dominant species.
- Shannon Index balances richness and evenness, favouring rare species.
- Both indices help ecologists measure and compare biodiversity accurately.
Evaluation
- Define species richness and species evenness in your own words.
- Which index is more sensitive to rare species: Simpson’s or Shannon’s?
- Why is species evenness important in assessing ecosystem health?
- Calculate Simpson’s Index for a habitat with three species having 4, 3, and 3 individuals respectively.
You’re not just learning to calculate numbers—you’re learning to understand life! With tools like these, you’ll be ready to protect nature in the smartest way. Afrilearn is proud of your growth and excited for the brilliant ecologist you’re becoming. Keep going—you’re doing wonderfully!