Back to: Mathematics Primary 4
HELLO, WELCOME BACK TO CLASS
A pictogram is a chart that uses pictures to represent data. Pictograms are set out in the same way as bar charts, but instead of bars they use columns of pictures to show the numbers involved. A pictograph is the representation of data using images. Pictographs represent the frequency of data while using symbols or images that are relevant to the data. This is one of the simplest ways to represent statistical data.
How to make a Pictograph
- Collect Data: First step is obviously collecting the data of the category you want to represent. Collect your data by appropriate means. And then make a list or table of the data. And one time finally review the data.
- Pick your symbol: Pick a symbol or picture that accurately represents your data. If you are drawing a pictograph to represent TV sets sold then a symbol of a basketball would be highly confusing! So pick your symbol carefully.
- Assign a Key: Sometimes the frequency of the data is too high. Then one symbol cannot represent one frequency. You must set a numerical value that one symbol will represent. This numerical value must be written along with the pictograph. Example one symbol of a TV represents 500 TV sets. This is the key of the pictograph.
- Draw the pictograph: Final step is drawing your pictograph. Draw the two columns that represent the category and the data. Then draw the actual symbols that represent the frequencies. Remember that the symbols can be drawn as fractions as well if the frequency is not a whole number.
- Review your Data: And finally, review your pictograph and make sure it correctly represents the information that you wanted to relay. Don’t forget to check the labelling of your graph.

Advantages of a Pictograph
- Express a large amount of information or data in a simple form
- Since they make the use of symbols, pictographs attract attention i,e, it is an attractive way to represent data
- Pictographs are easy to read since all the information is available at one glance
- And since pictographs are universally used they do not require a lot of explanation
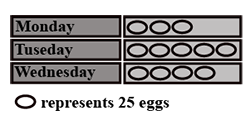
Question 1: The pictograph shows the number of eggs sold by a trader in three days. If the trader still had 115 eggs left after the three days, calculate the number of eggs he had at first.
- 187
- 425
- 415
- 98

Answer : The correct answer is “C”. Eggs Sold on the three days
Monday : 3 X 25 = 75
Tuesday: 5 X 25 = 125
Wednesday: 4 X 25 = 100
Eggs remaining = 115
Total number of eggs he had = 75 + 125 + 100 + 115 = 415
Question 2: The line plot below shows how students scored on last week’s math test. How many students scored 95 or higher on the test?
- 5 students
- 7 students
- 11 students
- 12 students

Mean, Median and Mode
Mean: the mean of any set of numbers is the average of the numbers, that is, the sum of items divided by the number of items.
Median: middle in set of ordered values: the middle value in a set of statistical values that are arranged in ascending or descending order.
Mode: the item which is most popular (or which occurs most often) on a set of data is called the mode. The item with the tallest or the longest bar in a bar chart is also the mode.
Examples:
- The marks scored by a certain number of pupils in a test are 2, 3, 5, 5, 6, 6, 6, 7.
Find the: (i) median (ii) mode (iii) mean of the data
Solution:
The median = (5+6) ÷ 2 = 11÷ 2 = 5 ½ or 5.5
The mode is 6, being the number which occurs most often
Mean score = 
- 2. Find: (i) the median (ii) the mode and (iii) mean of the following data
- a. 2, 3, 5, 6, 8, 9, 9
- b. 4, 9, 4, 13, 7, 14, 10, 17
- c. 8, 6, 12, 6, 10, 6
Solution:


MEAN AS AVERAGE
Examples:
- Find the average of the following marks obtained by 10 pupils in a Mathematics test.
8 12 14 8 15 18 20 16 19 20
Solution:
Average mark obtained

![]()
Hence, average mark obtained by the pupils is 15 marks.
- Find the average of the numbers 3, 4, 5, 6, 7, 8 and 9
Solution:

Examples:
- My mean mark in six tests is 9, if in the next two tests I score 6 and 4, what is my new average?
Solution:
Total number of marks scored in six tests = 6 x 9 = 54
Total number of marks scored in eight tests = 54 + 6 + 4 = 64
Mean = 64/8 = 8 marks
Hence, pupil’s new average mark is 8 marks
- The average height of 6 boys is 140 cm. they are joined by two boys. One is 147 cm tall and the other is 133 cm tall. What is the new average height of the 8 boys.
Solution:
Total height of 6 boys = 140 x 6 = 840 cm
Total height of 8 boys (that is, 6 + 2) = (840 + 147 + 133) cm = 1,120
Mean = 1,120 ÷ 8 = 140 cm
Quiz
- The people in a company, who will go on a holiday trip, are asked how they will travel to their holiday destination. The results are displayed in the pictogram below.
- The marks scored by a certain number of pupils in a test are 2, 3, 5, 5, 6, 6, 6, 7.
Find the: (i) median (ii) mode (iii) mean of the data

it was excited and I love it please do it again