Back to: Mathematics Primary 4
HELLO, WELCOME BACK TO CLASS
Bar Graph Definition
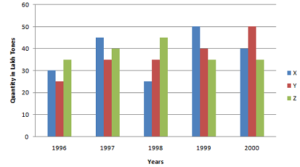
A bar graph is a way to display data graphically by using rectangle bars. These bars are uniform in width but vary in height or length. Also, the length of each bar represents a value. In addition, the bars can be vertical or horizontal. Another name for vertical bars is columns. We use bar graphs to compare various items or choices. We also use them to show how something has changed over a period of time. They can also be used to show the frequency of certain data. Other names for bar graphs are bar charts or column graphs.
How to Make and Use a Bar Graph
- Collect data: The first step in drawing any graph is to collect data. Since bar graphs is a comparative study, make sure you collect data for all the categories.
- Draw the axis: In any graph, there are two axes. Draw the x-axis and the y-axis.
- Label the axis: First, label the x-axis. On the x-axis, we represent the categories. For example, we label the names of chocolates i.e. A, B, C on the x-axis. Next, label the y-axis. To do this, take the highest frequency and plot the points on the y-axis accordingly.
- Draw the Columns: Finally, we draw the bars. In general, the bars are not connected or continuous. Now, extend the bars from the base value to their corresponding frequency. And if the value falls between the plotted frequencies, take an approximate point between the two.
- Interpret the Data: Once the bar graph is complete, we can interpret it. We can find out the most and least preferred choices. We can also identify the outliers.
Advantages of a Bar Graph
A bar graph is a pictorial representation of data. It is heavily used in math and statistics because it offers many advantages. Some such advantages are
- A bar graph diagrammatically represents data. This makes comparisons between different variables easy and convenient.
- They are actually the most popular method of displaying data because you can easily ascertain each separate frequency easily.
- Bar graphs are also the easiest diagram to prepare. They do not require too much effort
- Bar graphs are the most widely used method of data representation. They are in use in various industries, in retail, education and all sorts of businesses.
Examples
Question 1: What is the ratio of the total sales of branch B2 for both years to the total sales of branch B4 for both years?
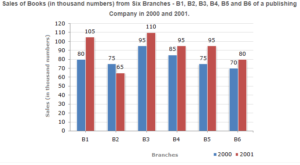
Answer : From the graph, the combined frequencies of B2 and B4 are
B2 = 75 + 65 = 140
B4 = 88 + 95 = 180
Therefore, ratio =140:180 = 7:9
Mean, Median and Mode
Mean: the mean of any set of numbers is the average of the numbers, that is, the sum of items divided by the number of items.
Median: middle in set of ordered values: the middle value in a set of statistical values that are arranged in ascending or descending order.
Mode: the item which is most popular (or which occurs most often) on a set of data is called the mode. The item with the tallest or the longest bar in a bar chart is also the mode.
Examples:
- The marks scored by a certain number of pupils in a test are 2, 3, 5, 5, 6, 6, 6, 7.
Find the: (i) median (ii) mode (iii) mean of the data
Solution:
The median = (5+6) ÷ 2 = 11÷ 2 = 5 ½ or 5.5
The mode is 6, being the number which occurs most often
![]()
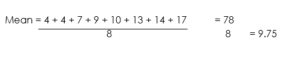
2. Find: (i) the median (ii) the mode and (iii) mean of the following data
a. 2, 3, 5, 6, 8, 9, 9
b. 4, 9, 4, 13, 7, 14, 10, 17
c. 8, 6, 12, 6, 10, 6
Solution:
Median = 6
Mode = 9
![]()
First, arrange in ascending order: 4, 4, 7, 9, 10, 13, 14, 17
Median = (9 + 10) ÷ 2 = 19 ÷ 2 = 9 ½ or 9.5
Mode = 4
First, arrange in ascending order: 6, 6, 6, 8, 10, 12
Median = (6 + 8) ÷ 2 = 14 ÷ 2 = 7
Mode = 6
![]()
MEAN AS AVERAGE
Examples:
- Find the average of the following marks obtained by 10 pupils in a Mathematics test.
8 12 14 8 15 18 20 16 19 20
Solution:
Average mark obtained
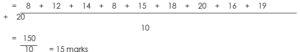
Hence, average mark obtained by the pupils is 15 marks.
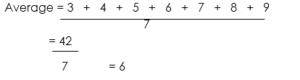
- Find the average of the numbers 3, 4, 5, 6, 7, 8 and 9
Solution:
Examples:
- My mean mark in six tests is 9, if in the next two tests I score 6 and 4, what is my new average?
Solution:
Total number of marks scored in six tests = 6 x 9 = 54
Total number of marks scored in eight tests = 54 + 6 + 4 = 64
Mean = 64/8 = 8 marks
Hence, pupil’s new average mark is 8 marks
- The average height of 6 boys is 140 cm. they are joined by two boys. One is 147 cm tall and the other is 133 cm tall. What is the new average height of the 8 boys.
Solution:
Total height of 6 boys = 140 x 6 = 840 cm
Total height of 8 boys (that is, 6 + 2) = (840 + 147 + 133) cm = 1,120
Mean = 1,120 ÷ 8 = 140 cm
Quiz
- What is the ratio of the total sales of branch B2 for both years to the total sales of branch B4 for both years?
- Find: (i) the median (ii) the mode and (iii) mean of the following data
- a. 2, 3, 5, 6, 8, 9, 9
- b. 4, 9, 4, 13, 7, 14, 10, 17
- c. 8, 6, 12, 6, 10, 6