Back to: MATHEMATICS SS1
Welcome to class!
In today’s class, we will be talking about the calculation of mean, median and mode of grouped data. Enjoy the class!
Calculation of Mean, Median and Mode of Grouped Data
Formula
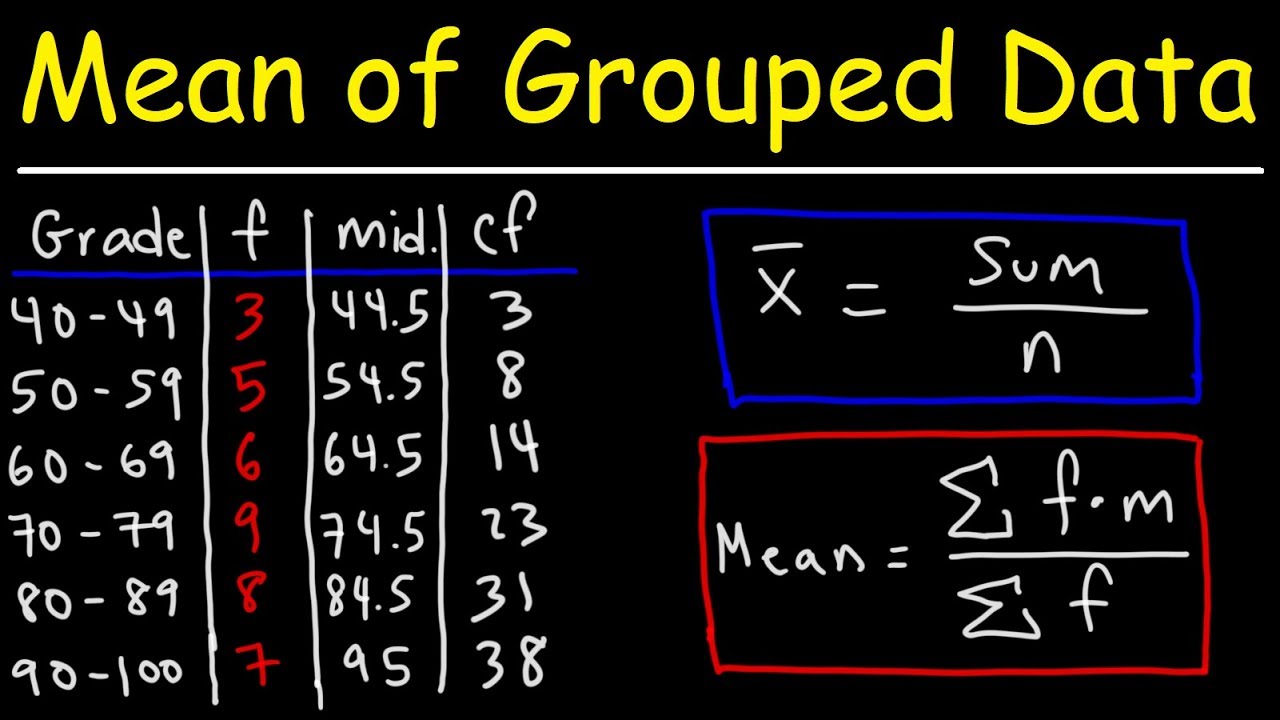
| 1. Mean ˉx = ∑fx/n |
| 2. Median M = L + n/2-c .c
F |
| Mode Z = L + (f1-f2⋅
2.f1-f0-f2)⋅c |
Examples
1. Calculate Mean, Median, Mode from the following grouped data
| Class | Frequency |
| 2 – 4 | 3 |
| 4 – 6 | 4 |
| 6 – 8 | 2 |
| 8 – 10 | 1 |
Solution
| Class (1) |
Frequency (f) (2) |
Mid value (x) (3) |
f⋅x (4)=(2)×(3) |
cf (6) |
| 2-4 | 3 | 3 | 9 | 3 |
| 4-6 | 4 | 5 | 20 | 7 |
| 6-8 | 2 | 7 | 14 | 9 |
| 8-10 | 1 | 9 | 9 | 10 |
| — | — | — | — | — |
| — | n=10 | — | ∑f⋅x=52 | — |
Mean ˉx = ∑fx/n
=5210
=5.2
To find Median Class
= value of (n2)th observation
= value of (102)th observation
= value of 5th observation
From the column of cumulative frequency cf, we find that the 5th observation lies in the class 4-6.
∴ The median class is 4-6.
Now,
∴L=lower boundary point of median class =4
∴n=Total frequency =10
∴cf=Cumulative frequency of the class preceding the median class =3
∴f=Frequency of the median class =4
∴c=class length of median class =2
Median M=L+n2-cff⋅c
=4+5-34⋅2
=4+24⋅2
=4+1
=5
To find Mode Class
Here, the maximum frequency is 4.
∴ The mode class is 4-6.
∴L=lower boundary point of mode class =4
∴f1= frequency of the mode class =4
∴f0= frequency of the preceding class =3
∴f2= frequency of the succeeding class =2
∴c= class length of mode class =2
Z=L+(f1-f02⋅f1-f0-f2)⋅c
=4+(4-32⋅4-3-2)⋅2
=4+(13)⋅2
=4+0.6667
=4.6667
In our next class, we will be talking about Statistical Graph. We hope you enjoyed the class.
Should you have any further question, feel free to ask in the comment section below and trust us to respond as soon as possible.