Back to: Mathematics Primary 6
HELLO, WELCOME BACK TO CLASS
Population is the total number of people living in an area. The area could be a town, state, school, country etc.
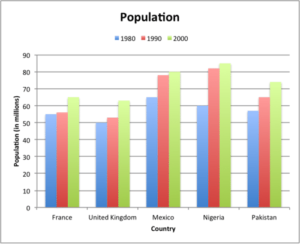
We can use bar graphs to interpret or show population in a place

The bar graph above is showing the population of five countries in three different years – 1980, 1990 and 2000.
How to Construct a Bar Graph?
Steps in construction of bar graphs/column graph:
- On a graph, draw two lines perpendicular to each other, intersecting at 0.
- The horizontal line is x-axis and vertical line is y-axis.
- Along the horizontal axis, choose the uniform width of bars and uniform gap between the bars and write the names of the data items whose values are to be marked.
- Along the vertical axis, choose a suitable scale in order to determine the heights of the bars for the given values. (Frequency is taken along y-axis).
- Calculate the heights of the bars according to the scale chosen and draw the bars.
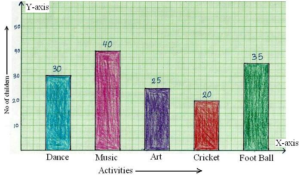
Bar graph gives the information of the number of children involved in different activities.

ACTIVITY
- The percentage of total income spent under various heads by a family is given below.
| Different Heads | Food | Clothing | Health | Education | House Rent | Miscellaneous |
| % Age of Total Number | 40% | 10% | 10% | 15% | 20% | 5% |
- Represent the above data in the form of a bar graph.
Statistics:
Statistics is the science concerned with developing and studying methods for collecting, analyzing, interpreting and presenting empirical data
In statistics, there are many kinds of averages, the most common are: mean, median and mode.
The “mean” is the “average” you’re used to, where you add up all the numbers and then divide by the number of numbers. The “median” is the “middle” value in the list of numbers. To find the median, your numbers have to be listed in numerical order from smallest to largest, so you may have to rewrite your list before you can find the median. The “mode” is the value that occurs most often. If no number in the list is repeated, then there is no mode for the list.
The “range” of a list a number is just the difference between the largest and smallest values.
Example:
- Find the mean, median, mode, and range for the following list of values:
13, 18, 13, 14, 13, 16, 14, 21, 13
- The mean is the usual average, so I’ll add and then divide:
(13 + 18 + 13 + 14 + 13 + 16 + 14 + 21 + 13) ÷ 9 = 15
- The median is the middle value, so first I’ll have to rewrite the list in numerical order:
13, 13, 13, 13, 14, 14, 16, 18, 21
There are nine numbers in the list, so the middle one will be the (9 + 1) ÷ 2 = 10 ÷ 2 = 5th number:
13, 13, 13, 13, 14, 14, 16, 18, 21
So, the median is 14.
- The mode is the number that is repeated more often than any other, so 13 is the mode.
- The largest value in the list is 21, and the smallest is 13, so the range is 21 – 13 = 8.
mean: 15
median: 14
mode: 13
range: 8
ACTIVITY
- Find the mean, median, mode, and range for the following list of values:
- 8, 9, 10, 10, 10, 11, 11, 11, 12, 13
- 12, 8, 4, 8, 1, 8, 9, 11, 9, 10, 12, 8
- 15, 22, 17, 19, 22, 17, 29, 24, 17, 15
- 0, 3, 2, 1, 3, 5, 4, 3, 42, 1, 2, 0
