Back to: ECONOMICS SS2
Welcome to class!
In today’s class, we will be talking about the measure of the dispersion of variation of grouped data. Enjoy the class!
MEASURES OF DISPERSION OF A GROUPED FREQUENCY DISTRIBUTION
CONTENT
- Range
- Mean Deviation
- Variance
- Standard Deviation
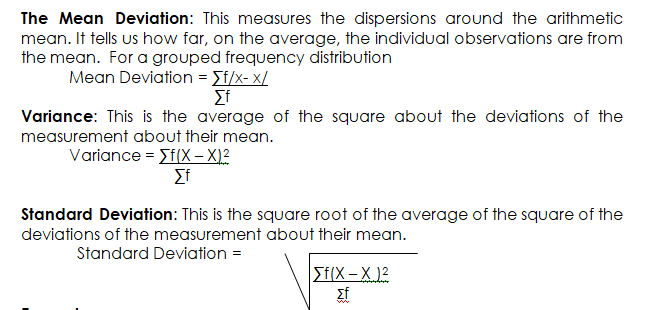
MEASURES OF DISPERSION: also known as measures of spread or variation describes how the data given in any distribution are spread about the ‘Mean’, or the overall spread of the data. These measures are the range, mean – deviation, standard deviation, variance, coefficient of variation, etc.
The Range: The range of data is the difference between the highest and the lowest value in the data. The formula for calculation of range is:
Range = Highest value – Lowest value
Example:
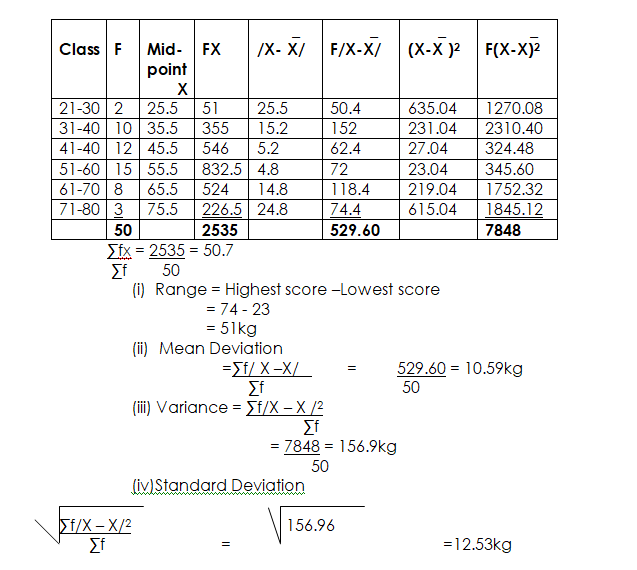
The data below shows the weight of 50 students to the nearest kg.
65 58 51 36 23 40 53 59 70 51 46 59 50 67 46 39 61 62 73 60 71 51 47 32 48 40 40 51 58 67 60 69 43 52 37 26 38 50 59 40 44 54 42 68 74 45 39 48 55.
- Prepare a grouped frequency table
- Calculate:
- The range
- The mean deviation
- The variance
- The standard deviation
NB: Note that the standard deviation is the positive square root of the variance.
|
Class |
F |
Mid-point X |
FX |
_
/X- X/ |
_ F/X-X/ |
_
(X-X )2 |
_
F(X-X)2
|
| 21-30 | 2 | 25.5 | 51 | 25.5 | 50.4 | 635.04 | 1270.08 |
| 31-40 | 10 | 35.5 | 355 | 15.2 | 152 | 231.04 | 2310.40 |
| 41-40 | 12 | 45.5 | 546 | 5.2 | 62.4 | 27.04 | 324.48 |
| 51-60 | 15 | 55.5 | 832.5 | 4.8 | 72 | 23.04 | 345.60 |
| 61-70 | 8 | 65.5 | 524 | 14.8 | 118.4 | 219.04 | 1752.32 |
| 71-80 | 3 | 75.5 | 226.5 | 24.8 | 74.4 | 615.04 | 1845.12 |
| 50 | 2535 | 529.60 | 7848 |
General evaluation
- How is the mid-point (X) ascertained in a grouped frequency table?
- State two advantages of the mean over other measures of central tendency (i.e. median and mode)
- The table below shows the income of forty Workers in a factory in N
61 78 70 83 92 67 66 83
76 68 79 84 82 86 81 60
78 77 86 77 81 92 80 70
70 40 75 60 74 82 77 87
63 94 76 87 81 77 87 84.
Using a class interval of 40-49, 50-59 etc.
- Construct a grouped frequency table of the distribution.
- Calculate the mean of the distribution.
Reading assignment
- Fundamentals of Economics for SSS by R.A I. Ayanwuocha Page 97-101
- Comprehensive Economics for SSS by J.U Anyaele page 36 –38
In our next class, we will be talking about the Theory of Consumer Behavior. We hope you enjoyed the class.
Should you have any further question, feel free to ask in the comment section below and trust us to respond as soon as possible.