Back to: ECONOMICS SS2
Welcome to class!
In today’s class, we will be talking about the measure of the central tendency of group data. Enjoy the class!
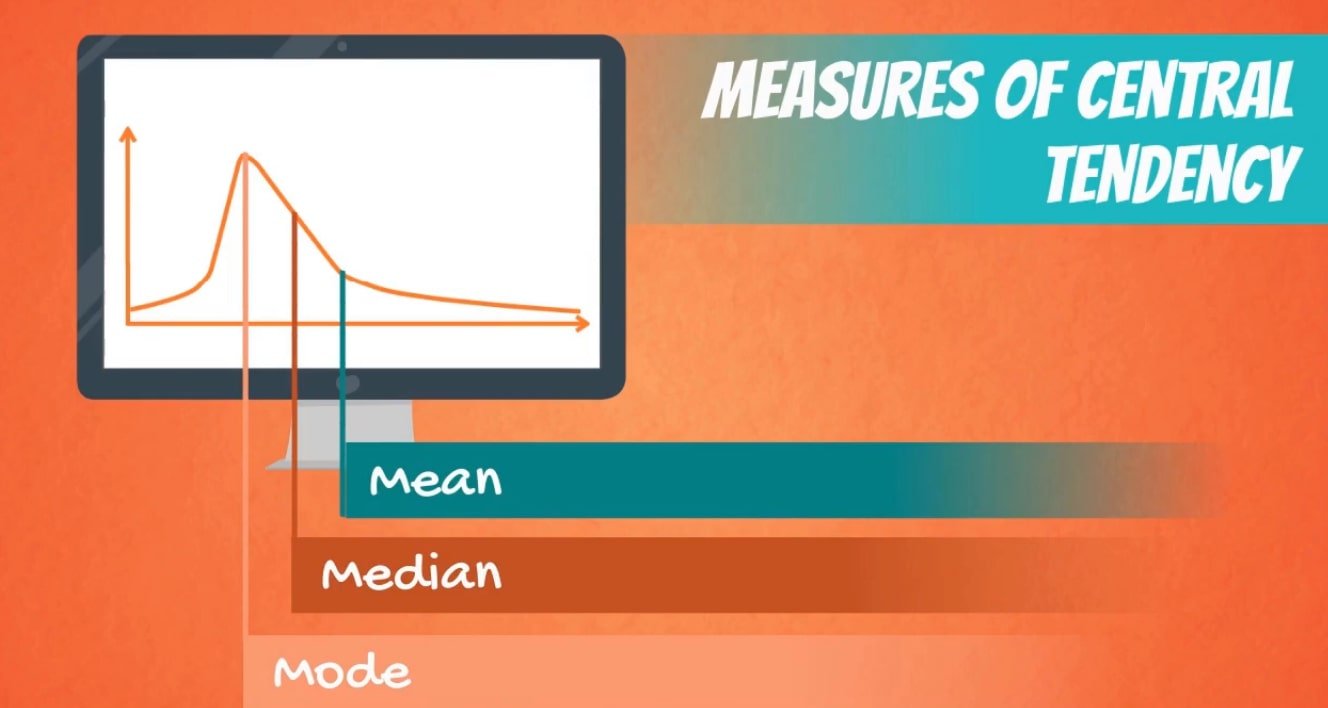
MEASURES OF CENTRAL TENDENCY
CONTENT
- MEAN
- MODE
- MEDIAN
They are the values which show the degree to which a given data or any given set of values will converge toward the central point of the data.
Measures of central tendency, also called measures of location, is the statistical information that gives the middle or centre or average of a set of data. Measures of central tendency include arithmetic mean, median and mode.
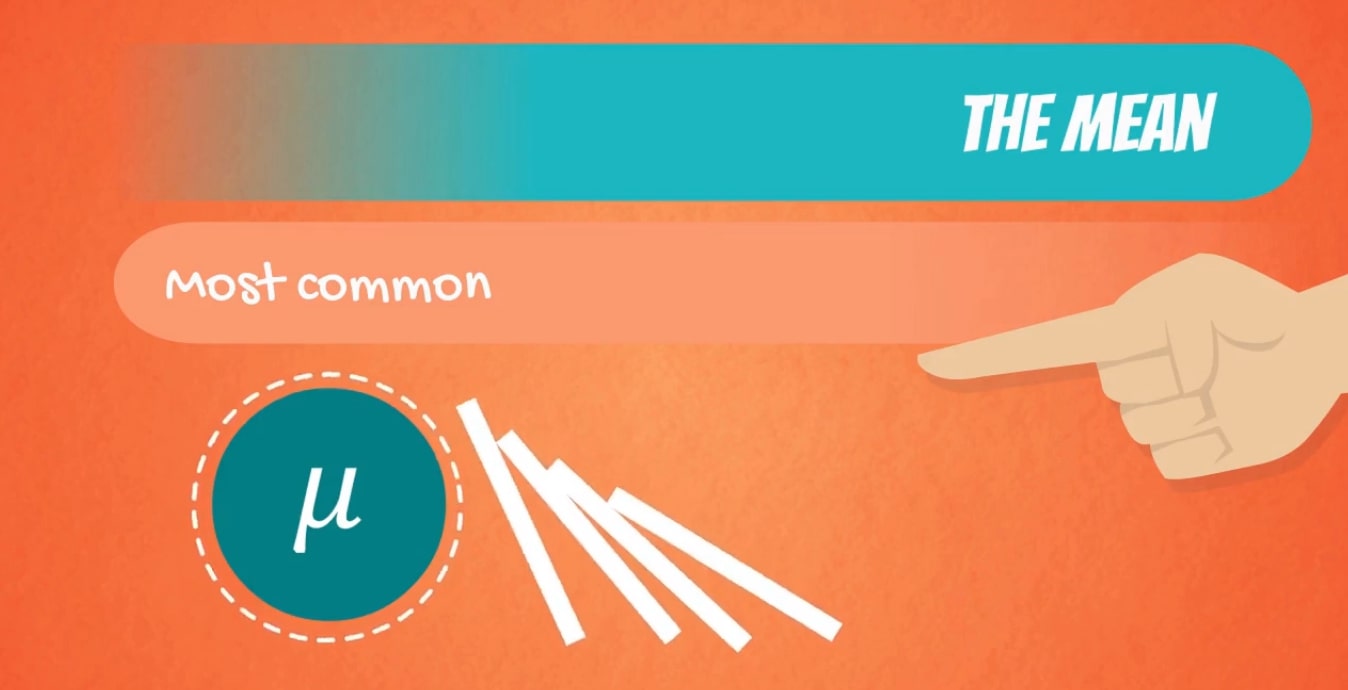
MEAN
This is the average of variables obtained in a study. It is the most common kind of average.
For group data the formula for calculating the mean is
Where
=Summation
F=frequency
X=observation
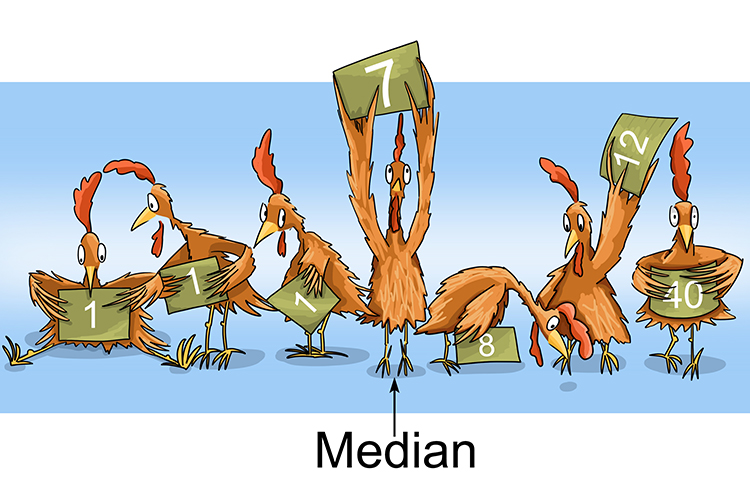
MEDIAN
It is the middle number in any given distribution. The formula is
Median =
Where; L = Lower class limit.
N = Summation 0f the frequency.
Fb = Cumulative frequency before the median class.
f = frequency of the median class.
c= Class size.
MODE
It is the number that appears most in any given distribution, i.e the number with the greatest frequency. When a series has more than one mode, say two, it is said to be bi-modal or tri-modal for three.
Mode =
Where M=mode
L = the lower class boundary of the modal class.
D1 = the frequency of the modal class minus the frequency of the class before the modal class.
D2 = the frequency of the modal class minus the frequency of the class after it.
C = the width of the modal class.
Example:
The table below shows the marks of students of JSS 3 mathematics.
|
Marks |
1-5 | 6-10 | 11-15 | 16-20 | 21-25 | 26-30 |
| Frequency | 2 | 3 | 4 | 5 | 6 | 7 |
Use the information above to calculate the following:
- the mean
- the median
- the mode
Solution
mark frequency mid-point fx
| 1-5 | 2 | 3 | 6 |
| 6-10 | 3 | 8 | 24 |
| 11-15 | 4 | 13 | 52 |
| 16-20 | 5 | 18 | 90 |
| 21-25 | 6 | 23 | 138 |
| 26-30
|
7 | 28 | 196 |
27 506
Mean=
B. Median
| Mark | F | Cf |
| 1-5 | 2 | 2 |
| 6-10 | 3 | 5 |
| 11-15 | 4 | 9 |
| 16-20 | 5 | 14 |
| 21-25 | 6 | 20 |
| 26-30 | 7 | 27 |
Median =
General evaluation
The table below shows the weekly profit in naira from a mini-market.
You are required to calculate:
- The mean.
- The median.
- The mode.
| Weekly profit(#) | 1-10 | 11-20 | 21-30 | 31-40 | 41-50 | 51-60 |
| Frequency | 6 | 6 | 12 | 11 | 10 | 5 |
Reading assignment
- Amplified and Simplified Economics for SSS by Femi Alonge page 29-30.
- Further Mathematics Scholastics Series page 265-265.
In our next class, we will be talking about the Measure of Dispersion of Variation of Grouped Data. We hope you enjoyed the class.
Should you have any further question, feel free to ask in the comment section below and trust us to respond as soon as possible.