Back to: AGRICULTURAL SCIENCE SS2
Welcome to Class !!
We are eager to have you join us !!
In today’s Agricultural Science class, We will be learning about Principles of Demand and Supply. We hope you enjoy the class!

SUPPLY
Supply may be defined as the quantity of goods which a producer is willing and ready to offer for sale at a given price over a given period of time. Quantity of goods offered for sale in the market is referred to as effective supply.
LAW OF SUPPLY
The law of supply states that the higher the price, the higher the quantity of produce that will be supplied or the lower the price, the lower the number of products that will be offered for sale.
SUPPLY SCHEDULE
Supply Schedule is the table which shows the relationship between price and quality of commodity supplied. See the table below.
| Price N | Quantity Supplied (kg) |
| 100 | 50 |
| 80 | 40 |
| 60 | 30 |
| 40 | 20 |
| 20 | 10 |
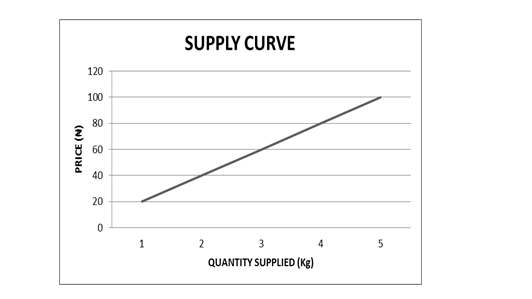
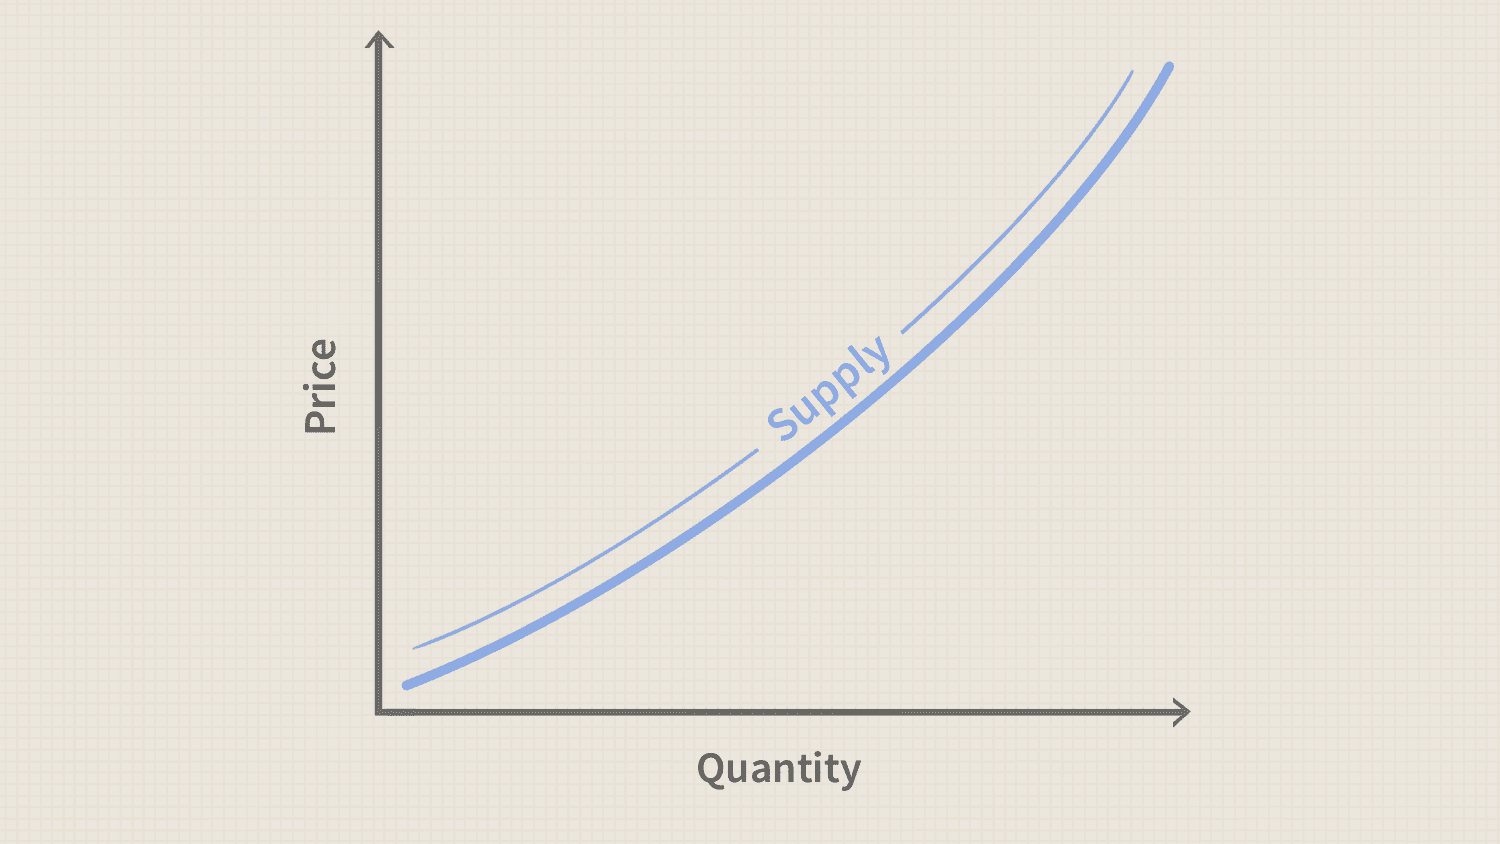
SUPPLY CURVE
Supply Curve is a graph showing the relationship between the price and quantity of goods supplied or offered for sale. The supply schedule is used to draw the supply curve as shown below.
Supply Curve:
FACTORS AFFECTING SUPPLY
- Price of good
- Level of Technology
- Cost of production
- Government Policy
- Weather condition
- Taxation
- Price of other commodities
- Number of producers
- Natural disasters
EVALUATION
- What is the supply?
- State the law of supply.
LAW OF DIMINISHING RETURN
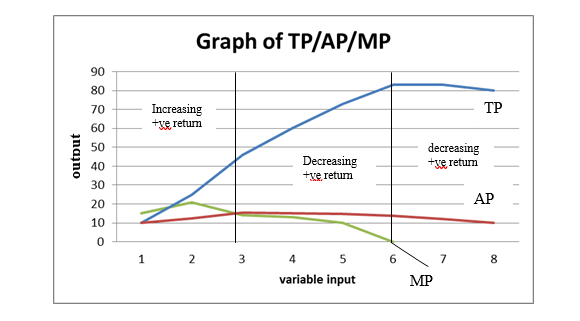
The law states that as successive amounts of a variable factor are applied to one or more fixed factors, the output might increase a lot at first, but there comes a point at which the use of an additional amount of the variable factor will add less to output than the proceeding amount.
In other words, it states that as more and more units of a variable factor of production are added to fixed factor, after a certain point, the marginal product diminishes or declines.
Diminishing returns is caused by poor/inexperienced management resulting in the use of more than required amount of one or more factors of production thereby making them less effective.
IMPORTANCE OF LAW OF DIMINISHING RETURNS IN AGRICULTURE
- It enables managers to effectively combine factors of production to attain optimal output.
- It minimizes wastage on unproductive input.
DEFINITION OF TERMS
- Fixed factors: these are assets or resources whose value does not change in the short run e.g. Land
- Variable factor: these are assets or resources whose value changes in the short run e.g. capital, labour
- Total product (TP or Q): is the overall quantity of output or yield produced by the farm.
- Average product (AP): is the overall quantity of output or yield produced by the farm per variable input.

5. Marginal product (MP): is the change in quantity produced resulting from a change in the variable input.
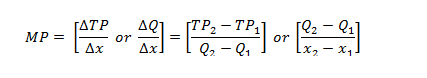
This can be represented in the table below;
| Fixed factor | Variable factor | Total output (kg) | Marginal product (kg) | Average product (kg) |
| 10 | 1 | 10 | – | 10 |
| 10 | 2 | 25 | 15 | 12.5 |
| 10 | 3 | 46 | 21 | 15.3 |
| 10 | 4 | 60 | 14 | 15 |
| 10 | 5 | 73 | 13 | 14.6 |
| 10 | 6 | 83 | 10 | 13.8 |
| 10 | 7 | 83 | 0 | 11.9 |
| 10 | 8 | 80 | -3 | 10 |
Graph demonstrating the law of diminishing return
CLASS ACTIVITY (WAEC PQ)
- State the law of diminishing returns.
- Using the table below, make an input-output graph and describe the relationship between fertilizer used and maize yield.
| Quantity of fertilizer (bags) | 0 | 4 | 8 | 12 | 16 | 20 | 24 | 28 | 32 | 36 |
| Maize yield (Kg) | 8 | 24 | 48 | 80 | 120 | 150 | 170 | 180 | 180 | 170 |
- Explain the main cause of diminishing returns in agricultural production.
GENERAL EVALUATION
- What is demand?
- State the law of demand
- What is the supply?
- State the law of supply
- State the law of diminishing return
- Differentiate between total product, marginal product and average product.
READING ASSIGNMENT
- Essential Agricultural Science for Senior Secondary School by O.A. Iwena Chapter 35 pages 343 – 347 and Chapter 37 pages 353 – 362,
- Answer the following questions from WAEC PAQ 2007 theory question 9, 2008 theory question 9 & 10, 2012 theory question 9 & 10, 2014 theory question 5, 2017 theory question 6, 2000 theory question 9, 1994 theory question 9 and 1991 theory question 9
THEORY
Complete this table
| Quantity of fertilizer (bags) | 0 | 4 | 8 | 12 | 16 | 20 | 24 | 28 | 32 | 36 |
| Maize yield (Kg) | 8 | 24 | 48 | 80 | 120 | 150 | 170 | 180 | 180 | 170 |
| Marginal product (Kg) | ||||||||||
| Average product (Kg) |
We have come to the end of this class. We do hope you enjoyed the class?
Should you have any further question, feel free to ask in the comment section below and trust us to respond as soon as possible.
In our next class, we will be learning about Farm Records and Farm Accounts. We are very much eager to meet you there.