Back to: MATHEMATICS SS2
Welcome to class!
In today’s class, we will be talking more about statistics. Enjoy the class!
Statistics II

Cumulative Frequency Curve
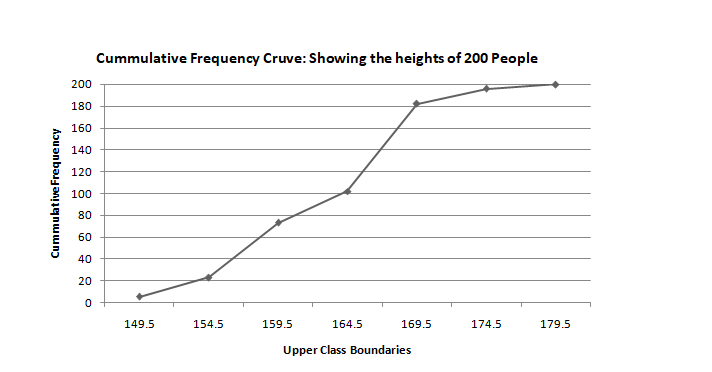
The cumulative frequency curve is also called the OGIVE. It is the graph of the cumulative frequency against the upper class boundary.
Example
The table below shows the height of 200 people who were randomly picked.
| Heights(cm) | 145 -149 | 150 – 154 | 155 – 159 | 160 – 164 | 165 – 169 | 170 -174 | 175 – 179 |
| Frequency | 5 | 18 | 50 | 29 | 80 | 14 | 4 |
Construct for the distribution above, a cumulative frequency curve.
Solution
| Heights | Frequency | Cumulative Frequency | Upper Class Boundary |
| 145 – 149 | 5 | 5 | < 149.5 |
| 150 – 154 | 18 | 23 | < 154.5 |
| 155 – 159 | 50 | 73 | < 159.5 |
| 160 – 164 | 29 | 102 | < 164.5 |
| 165 – 169 | 80 | 182 | < 169.5 |
| 170 – 174 | 14 | 196 | < 174.5 |
| 175 – 179 | 4 | 200 | < 179.5 |
EVALUATION
The table shows the masses of various quantities of maize sold by a farmer during the year 1985.
| Mass (kg) | 40 – 43 | 44 – 47 | 48 – 51 | 52 – 55 | 56 – 59 | 60 – 63 | 64 -67 | 68 – 71 |
| Frequency | 7 | 18 | 32 | 48 | 41 | 28 | 17 | 19 |
- Draw a cumulative frequency table. (b) Using a scale of 2cm to 4 kg on the x-axis and 2cm to 20units on the y-axis, draw the cumulative frequency curve.
GENERAL EVALUATION
Given the frequency distribution below. Draw a histogram and a cumulative frequency curve.
| Height (cm) | 160 – 164 | 165 – 169 | 170 – 174 | 175 – 179 | 180 – 184 | 185 – 189 | 190 – 194 |
| Frequency | 10 | 25 | 40 | 56 | 44 | 20 | 5 |
In our next class, we will be talking more about Statistics. We hope you enjoyed the class.
Should you have any further question, feel free to ask in the comment section below and trust us to respond as soon as possible.