Back to: MATHEMATICS SS2
Welcome to class!
In today’s class, we will be talking more about statistics. Enjoy the class!
Statistics III

MEAN, MEDIAN AND MODE OF GROUPED DATA
MEAN: The arithmetic mean of grouped frequency distribution can be obtained using:
Class Mark Method:
X = where x is the midpoint of the class interval.
Assumed Mean Method: It is also called working mean method. X = A + (∑ Fd/∑f)
Where, d = x – A, x = class mark and A = assumed mean.
EXAMPLE:
The numbers of matches in 100 boxes are counted and the results are shown in the table below:
| Number of matches | 25 – 28 | 29 – 32 | 33 – 36 | 37 – 40 |
| Number of boxes | 18 | 34 | 37 | 11 |
Calculate the mean (i) using the class mark (ii) assumed mean method given that the assumed mean is 30.5.
Solution
| Class interval | F | X | FX | d = x – A | Fd |
| 25 – 28 | 18 | 26.5 | 477 | – 4 | – 72 |
| 29 – 32 | 34 | 30.5 | 1037 | 0 | 0 |
| 33 – 36 | 37 | 34.5 | 1276.5 | 4 | 148 |
| 37 – 40 | 11 | 38.5 | 423.5 | 8 | 88 |
| Total | 100 | 3214 | 164 |
- Class Mark Method: X = = 3214/100 = 32. 14 = 32 matches per box (nearest whole no)
- Assumed Mean Method: X = A + (∑ Fd/∑f) = 30. 5 + (164/100) =30.5 + 1.64 = 32.14 = 32 matches per box (nearest whole number)
EVALUATION
Calculate the mean shoe sizes of the number of shoes represented in the table below using (i) class mark (ii) assumed mean method given that the assumed mean is 42.
| Shoe sizes | 30 – 34 | 35 – 39 | 40 – 44 | 45 – 49 | 50 – 54 |
| No of Men | 10 | 12 | 8 | 15 | 5 |
MODE
The mode of a grouped frequency distribution can be determined geometrically and by interpolation method.
Mode from Histogram: The highest bar is the modal class and the mode can be determined by drawing a straight line from the right top corner of the bar to the right top corner of the adjacent bar on the left. Draw another line from the left top corner to the bar of the modal class to the left top corner of the adjacent bar on the right.
Example:
The table gives the distribution of ages of students in an institution.
| Ages (year) | 16 – 18 | 19 – 21 | 22 – 24 | 25 – 27 | 28 – 30 |
| No of Students | 18 | 30 | 35 | 24 | 13 |
Draw a histogram and use your histogram to estimate the mode to the nearest whole number.
Solution
| Class Interval (Ages) | F | Class Boundary |
| 16 – 18 | 18 | 15.5 – 18. 5 |
| 19 – 21 | 30 | 18.5 – 21.5 |
| 22 – 24 | 35 | 21.5 – 24.5 |
| 25 – 27 | 24 | 24.5 – 27.5 |
| 28 – 30 | 13 | 27.5 – 30.5 |
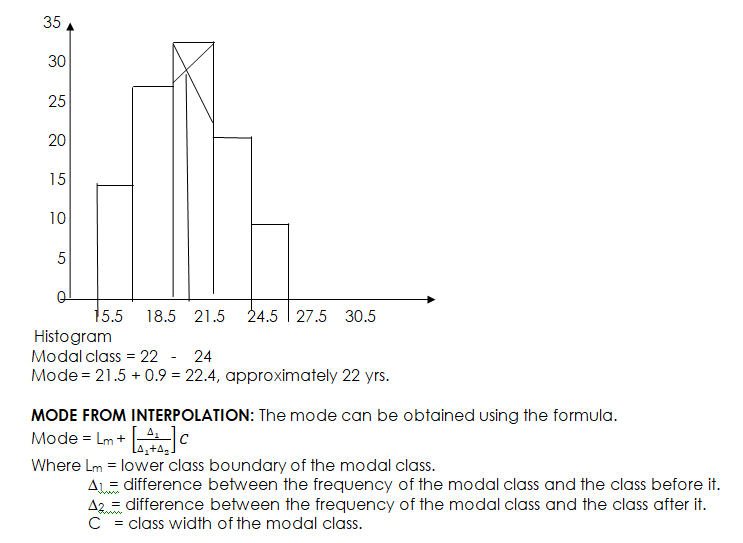
Example: Using the table given in the example above:
Modal class = 22 – 24, ∆1 = 35 – 30 = 5, ∆2 = 35 – 24 = 11, C = 3, Lm = 21.5
Mode = 21.5 + 5 3
5 + 11
= 21.5 + (15/16) = 21.5 + 0.9375
= 22.44, approximately 22 yrs.
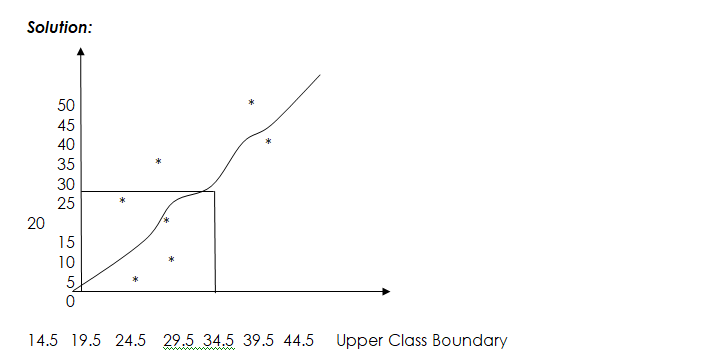
MEDIAN OF GROUPED DATA:
The median of grouped data can be determined from a cumulative frequency curve and the interpolation formula.
Median from Cumulative Frequency Curve: The cumulative frequency curve can be used to determine the median.
EXAMPLE: The table below shows the masses of 50 students in a secondary school
| Masses (kg) | 10 – 14 | 15 – 19 | 20 – 24 | 25 – 29 | 30 – 34 | 35 – 39 | 40 – 44 |
| Frequency | 3 | 7 | 9 | 5 | 11 | 6 | 9 |
- Prepare a cumulative frequency table for the data.
- Draw the ogive and use your graph to find the median.

GENERAL EVALUATION
The table below gives the distribution of masses (kg) of 40 people
| Masses (kg) | 1 – 5 | 6 – 10 | 11 -15 | 16 – 20 | 21 – 25 | 26 – 30 | 31 – 35 | 36 – 40 |
| Frequency | 9 | 20 | 32 | 42 | 35 | 22 | 15 | 5 |
- State the modal class of the distribution and find the mode.
- Draw a cumulative frequency curve to illustrate the distribution.
- Use the curve in ‘2’ to estimate the median.
- Calculate the mean of the distribution.
In our next class, we will be talking about Probability. We hope you enjoyed the class.
Should you have any further question, feel free to ask in the comment section below and trust us to respond as soon as possible.