Back to: Computer Science JSS 3
Welcome to class!
In today’s class, we shall be talking about the uses of spreadsheet packages. Please enjoy the class!
Uses of Spreadsheet Packages
Spreadsheet packages like Microsoft Excel or Google Sheets are ubiquitous in our digital world. They’re not just for accountants and analysts anymore! From personal budgeting to scientific research, spreadsheets offer a versatile and user-friendly way to organize, analyze, and visualize data in a compelling way. Let’s delve into the power of these digital worksheets and explore the diverse ways they can be used:
1. Data Organization and Management:
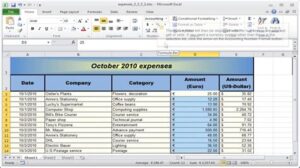
Spreadsheets excel at organizing large amounts of data. Whether it’s customer information, inventory lists, or scientific measurements, you can neatly arrange it in rows and columns for easy access and manipulation.
With a spreadsheet, you have no need to find a specific customer or identify trends in your data? Spreadsheets offer powerful sorting and filtering tools to quickly navigate through large datasets and pinpoint the information you need.
It also ensures data accuracy with built-in validation tools. Set criteria for what can be entered in each cell, preventing typos and inconsistencies that can skew your analysis.
2. Numerical Calculations and Analysis:
From simple addition and subtraction to advanced statistical functions, spreadsheets can handle a wide range of calculations. Analyze financial data, calculate scientific formulas, or track project budgets with ease.
It can automate repetitive tasks and calculations with custom formulas. Define relationships between cells, and changes in one cell automatically update the others, saving you time and effort.
They are also used to model different scenarios and predict future outcomes. Experiment with different variables and assumptions to make informed decisions based on data-driven insights.
- Data Visualization and Communication:
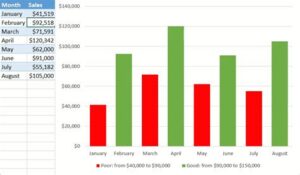
They can transform dry data into compelling visuals. Create charts, graphs, and other visual representations to identify trends, patterns, and relationships within your data.
Spreadsheets goes beyond static charts and build interactive dashboards. Link charts and graphs to specific data points, allowing users to explore and analyze the information in real-time.
Also helpful to share your findings with colleagues, clients, or stakeholders using visually appealing and informative spreadsheets. Present your data in a clear and concise way to drive understanding and action.
Spreadsheets are not just for number crunching! They can be used for:
- Project Management: Track tasks, deadlines, and resources with project management templates.
- Personal Budgeting and Finance: Manage your income, expenses, and investments with budgeting templates.
- And Educational and Research: Analyze scientific data, create learning materials, and track student progress.
Remember:
Choose the Right Tool: Different spreadsheet packages offer varying features and capabilities. Select one that suits your needs and skill level.
Start Simple: Don’t get overwhelmed by complex functions. Begin with basic tasks and gradually build your skills.
Explore and Learn: There are countless resources available online and in libraries to help you master the art of spreadsheets.
With their versatility, power, and ease of use, spreadsheet packages are truly valuable tools for anyone who wants to organize, analyze, and communicate data effectively. So, unleash the power of your spreadsheet and unlock a world of possibilities!
We have come to the end of today’s class. I hope you enjoyed the class!
In the next class, we shall be discussing the Spreadsheet features and terminologies.
In case you require further assistance or have any questions, feel free to ask in the comment section below, and trust us to respond as soon as possible. Cheers!
Question Time:
Part A: Objective Test (Multiple Choice)
- Which of the following is NOT a primary function of a spreadsheet package?
- a) Data organization and management
- b) Word processing
- c) Data analysis and calculations
- d) Data visualization
- What is the benefit of using cell formatting in a spreadsheet?
- a) Only for improving aesthetics
- b) Enhance data clarity and readability
- c) Apply formulas to specific cells
- d) Increase storage capacity
- Which formula would you use to calculate the average of values in cells A1 to A10?
- a) AVERAGE(A1:A10)
- b) SUM(A1:A10) / 10
- c) COUNT(A1:A10)
- d) None of the above
- ou want to highlight all cells containing values greater than 50. Which spreadsheet feature would you use?
- a) Cell formatting
- b) Sorting
- c) Filtering
- d) Conditional formatting
- What is the main advantage of using charts and graphs in a spreadsheet?
- a) Save storage space
- b) Reduce data complexity
- c) Identify trends and patterns
- d) Perform calculations easily