Back to: MATHEMATICS JSS 2
Welcome to Class !!
We are eager to have you join us !!
In today’s Mathematics class, We will be discussing “Graph of Linear Equations into two variables”. We hope you enjoy the class!
CONTENT
- The position of points on a line
- Cartesian plane/coordinates
- Plotting points
The position of points on a line
The number line is a picture or graph of the relative position of positive and negative numbers.
Worked Examples
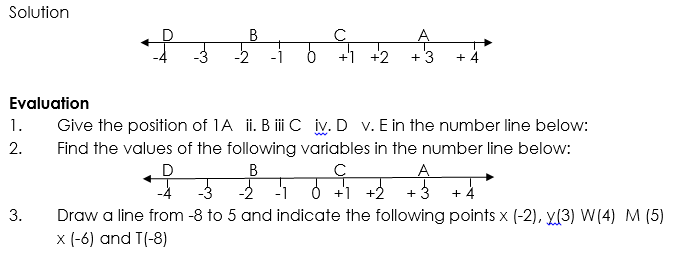
- Find the values of the following variables in the number line below:
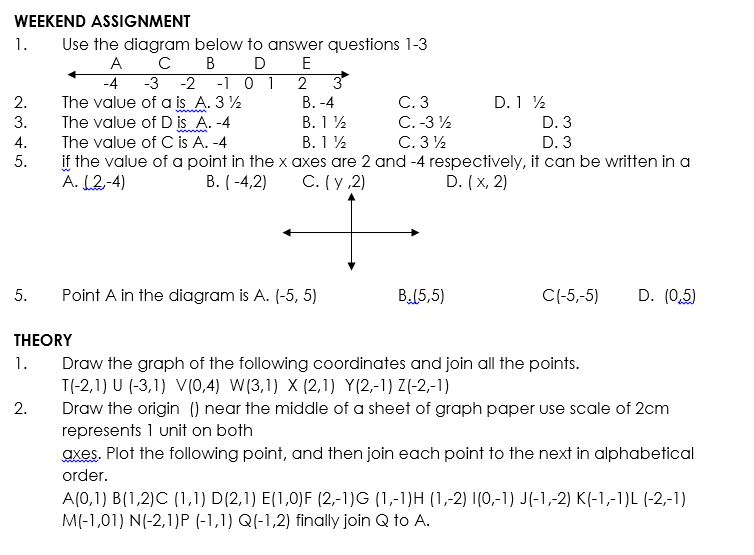
D B C A
-4 -3 -2 -1 0 +1 +2 + 3 + 4
Solution
- A is 3 units to the right of zero = A (3)
- B is 1 unit to left of zero = B (-1)
- C is 1 ½ units to the right of zero = 1 ½
- D is 2 units to the left of zero = (-2)
Draw a number line from -5 to 5 in the number line mark.
- 2 B. (-4) C. (-2 ½) and D. (1)
READING ASSIGNMENT
New General Mathematics UBE Edition, Chapter 12, Nos 1- 2pgs102-107
Essential Mathematics by A. JS. Oluwasanmi Chapter15 pgs 152 -155
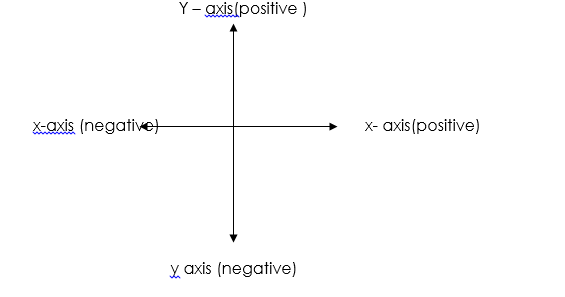
Cartesian Plane/Coordinate
Cartesian graphs give a picture of the relative position of a point on a plane. The Cartesian plane is a plane surface with two axes drawn on it. The axes are at right angles to each other . they are the horizontal ( x-axis) and the vertical (y-axis) crossing at the origin (the zero point for both axes).
COORDINATES
Every point on the Cartesian plane has a unique ordered pair of coordinates in the form ( a,b) where a is x – coordinates (the distance of the point along the x-axis) and b is the y-coordinates ( the distance of the point along the y-axis).
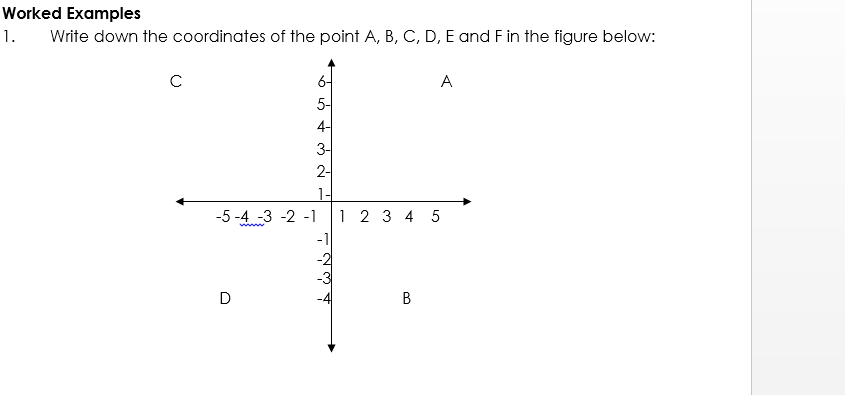
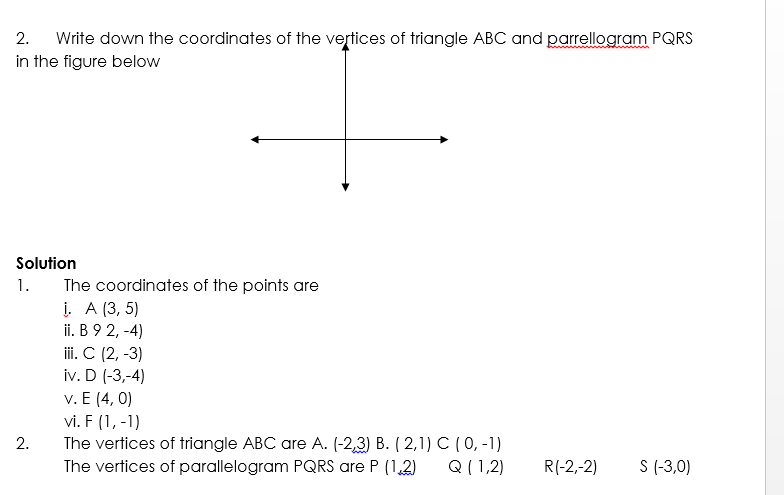
Solution
- The coordinates of the points are
-
- A (3, 5)
- B 9 2, -4)
- C (2, -3)
- D (-3,-4)
- E (4, 0)
- F (1, -1)
-
- The vertices of triangle ABC are A. (-2,3) B. ( 2,1) C ( 0, -1)
The vertices of parallelogram PQRS are P (1,2) Q ( 1,2) R(-2,-2) S (-3,0)
READING ASSIGNMENT
New General Mathematics UBE Edition, Chapter 12, Nos 1- 2pgs105-107
Essential Mathematics by A. JS. Oluwasanmi Chapter15 pgs 237-239
Plotting Point
Plotting points means to draw its positions on the Cartesian plane. The easiest way to plot a graph is as follows:
Start at the origin
- Move along the x-axis by the amount and in a direction given by the x-coordinates of the point.
iii. move up or down parallel to the y-axis by an amount in a direction given by the y- coordinates.
REVISION QUESTION
- Draw the origin O, near the middle of a sheet of graph paper using a scale of 2cm, represent 5 units on both sides. Plot the following points. Join each points to the next in order they are given start (-10,-5 ) (-5,10) (0,15) (5,17) (3,14) (3,12) (15,6) (14,3) (11,3),1 (13,2) (5,3) (6,-6) >
What pictures does your graph show?
We have come to the end of this class. We do hope you enjoyed the class?
Should you have any further question, feel free to ask in the comment section below and trust us to respond as soon as possible.
In our next class, we will be talking about Linear Graphs in two Variables. We are very much eager to meet you there.