Back to: MATHEMATICS JSS 2
Welcome to Class !!
We are eager to have you join us !!
In today’s Mathematics class, We will continue our discussion from last class on Statistics. We hope you enjoy the class!
CONTENT:
i. Rank order list
ii Frequency table
iii. The line graph
RANK ORDER LIST
Raw data: Data which is in random order (i.e.) arranged in any kind of order is called raw data. One way to present or organize the data in a more meaningful way is to arrange it in rank order or sorting it into categories. Rank order means in order from highest to lowest. Note: Data should be presented clearly. A good presentation makes statistical data easy to read and understand.
Example: B,C,A,B,A,D,E,C,A,B,B,E,B. this 15 grade are given rank order below:
A,A,AB,B,B,B,C,C,C,D,E,E,F.
Reading Assignment
- New general mathematics for JSS 1 by JB Channon page125
- Essential mathematics for JSS 1 by AJS Oluwasanmi page 183
FREQUENCY TABLE
Raw can also be arranged in a table called the frequency table as shown in the diagram below. The number of times each particular value occurs is called its frequency. The frequency table is usually made up of three columns.
- The first column contains each item (or each of the events) given in the raw data and they are usually arranged in order of magnitude starting with the smallest.
- The second column contains the tally charts which represent the number of times a particular item or events takes place.
- The third column is called the frequency column. To find the frequency of each item, simply add or count the tally marks in each row. To find the total frequency must be equal to the following raw data shows the number of vehicles owned by 25 businessmen in Lagos.
Example: 2, 5, 4, 6,3, 4, 7, 5, 7, 7, 8, 9, 5, 3,4, 4, 8, 2, 2, 2, 5
| Vehicles | Tally | Frequency |
| 2 | III | 3 |
| 3 | III | 3 |
| 4 | IIII | 5 |
| 5 | IIII | 4 |
| 6 | I | 1 |
| 7 | IIII | 4 |
| 8 | II | 2 |
| 9 | I | 1 |
| TOTAL | 25 |
Evaluation
The following figures show the number of children performing in a sample of 40 households.
1, 2, 4, 3, 5, 8, 3, 2, 2, 3, 4, 5, 6, 5, 4, 2, 1, 3, 2, 4, 5, 3, 8, 7, 6, 3, 8, 6, 3, 5, 7, 5, 4, 3
- Use a tally mark to prepare a frequency table for this data.
- What is the highest frequency to the number of children per family?
Reading Assignment
Essential mathematics by AJS Oluwasanmi page 184 – 185
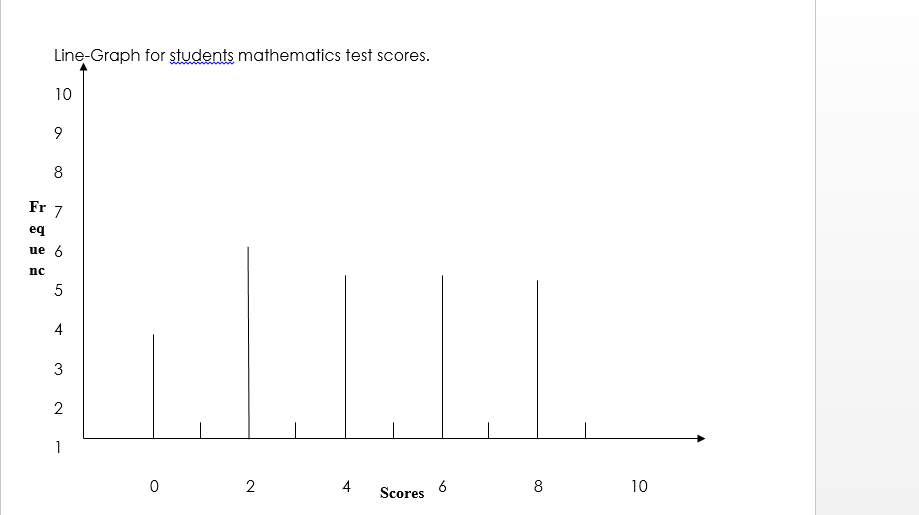
THE LINE GRAPH
A Line-Graph is a bar-chart with bar replaced by straight lines which represent the frequency of each item.
Example: The scores of 30 students in mathematics test are shown below
8, 6, 2, 0, 0, 2, 4, 1, 0, 6
4, 2, 8, 8, 1, 0, 0, 2, 4, 2
2, 8, 6, 4, 1, 0, 0, 6, 2, 4
Use the frequency table to construct a line-graph solution
| Vehicles | Tally | Frequency |
| 0 | IIII II | 7 |
| 1 | III | 3 |
| 2 | IIII II | 7 |
| 4 | IIII | 5 |
| 6 | IIII | 4 |
| 6 | IIII | 4 |
GENERAL EVALUATION QUESTION
Twenty four pupils went out to pick some pears. The number of pears picked by each pupil was recorded as follows:
6, 4, 3, 2, 3, 4, 1, 3, 5, 1, 6, 2,
2, 3, 2, 2, 3, 5, 2, 4, 3, 3, 1, 6
- Prepare a tally sheet and frequency table for the data
- Construct a line-graph for the distribution
- Which is the least number of pears picked?
REVISION QUESTION
The shoe sizes of 20 boys are as follows:
8, 10, 9, 10, 11, 9, 8, 9, 12, 9
10, 9, 9, 8, 8, 9, 10, 19, 9, 11
- Prepare a tally sheet and frequency table for the data
- Which shoe size is the most common among the boys?
- How many boys wear size 10 and above?
READING ASSIGNMENT
Essential Mathematics for JSS 2 chapter 23, pages 295 – 298
Exercise 23.2 No 7 pages 301
WEEKEND ASSIGNMENT
- What number is represented by the tally marks shown below?
IIII IIII IIII III
A. 18 B. 23 C. 13 D. 43
The table below shows the marks obtained by students in a physics test.
| Mark | 5 | 6 | 7 | 8 | 9 | 10 |
| Tally | II | II | IIII I | IIII III | III | IIII |
- How many students did the test? A. 35 B. 34 C. 30 D. 25
- What mark did most students get? A. 5 B. 9 C. 8 D. 7
- If 8 is the pass mark, what fraction of the students failed the test?
- The most frequently used value occurring in a set of data is known as A. median B. mean C. average D. mode
THEORY
- The scores of some students in mathematics test were as follows: 1, 0, 7, 7, 8, 6, 1, 0, 8, 8, 9, 6, 5, 9, 9, 8, 8, 5, 5, 1, 0, 9, 9, 8, 9, 7, 5, 9, 7, 1, 0, 8, 6, 7, 7, 8, 1, 0
-
-
- Form a frequency table distribution
- How many students wrote the test?
- How many students scored less than seven?
- Which score occurred most often
-
- The following are the number of goals during inter-house football competition in a certain school.
5 0 4 2 5 1 3
2 4 0 0 3 0 2
1 2 3 3 4 0 5
Draw a line graph for the data.
We have come to the end of this class. We do hope you enjoyed the class?
Should you have any further question, feel free to ask in the comment section below and trust us to respond as soon as possible.
In our next class, we will be having a look at Pictograms, Bar Charts and Pie Charts. We are very much eager to meet you there.