Back to: MATHEMATICS JSS 2
Welcome to Class !!
We are eager to have you join us !!
In today’s Mathematics class, We will be discussing Linear Graphs in two Variables. We hope you enjoy the class!
CONTENT
- Continuous graphs
- Graph of real-life situations
- Choosing scales.
Continuous Graph: Graphs are used to show the relationship between two quantities. A continuous graph is in the form of a continuous line and shows the relationship between the two quantities.
Worked Examples
1a. A student walked along a road at a speed of 120m per minute.
Make a table of values showing how far the students have walked after 0, 1, 2,3,4,5, minutes
- using the scale of 1cm to 1min on the horizontal axis and 1cm to 100m on the vertical axis, draw a graph of the information. use the graph to find:
-
- how far the students have walked after 2.6min.
- how long it takes the students to walk 500m
-
Solution
| Time(min) | 0 | 1 | 2 | 3 | 4 | 5 |
| Distance(m) | 0 | 120 | 240 | 360 | 480 | 600 |
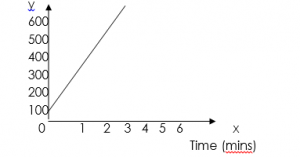
- The student has walked 310cm after 2.6min.
- The student takes about 4.5 in walk 500m
Distance-time graphs
We use distance-and-time graphs to show journeys. It is always very important that you read all the information shown on these type of graphs.
A graph showing one vehicle’s journey
If we look at the graph shown below, you can see that the time in hours is along the horizontal, and the distance in miles is on the vertical axis. This graph represents a journey that Jan took, in travelling to Glasgow and back, from Aberdeen.
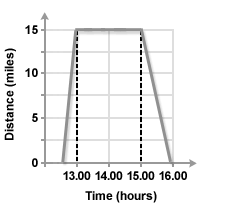
Important points to note are:
It took half an hour to travel a distance of miles
Between 1 pm and 3 pm, there was no distance travelled. This means that the car had stopped.
The journey back, after 3 pm, took one hour.
A graph showing two different journeys in the same direction
The next graph shows two different journeys. You can see that there is a difference with the steepness of the lines drawn. Remember that, the steeper the line, the faster the average speed. We can calculate the average speeds, by reading distances from the graph and dividing by the time taken.
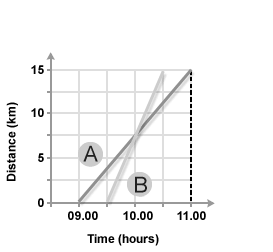
Line A: How long does journey A last, and what distance is travelled?
The journey takes 2 hours, and the distance travelled is 15km.
Line B: How long does journey B last, and what distance is travelled?
The journey takes 1 hour, and the distance travelled is also 15 km.
This means that the average speeds are:
A: 15/2 = 7.5 km per hour
B: 15/1 km per hour
You will also notice from the graph that the two lines cross. This means that, if the two vehicles were travelling along the same route, they would have met at that point, which was just after 10 am. The vehicle on journey B overtook vehicle A.
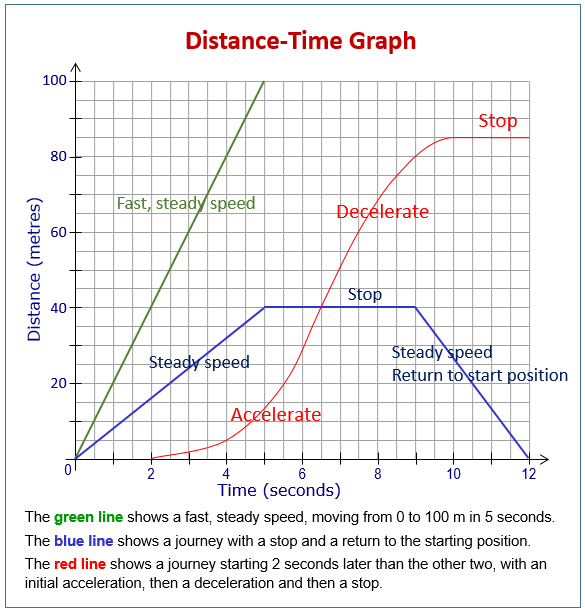
A graph showing two journeys in the opposite direction
A different pair of journeys is shown below. It is important to note that one journey begins at a distance of 0 miles, and the other at a distance of 40 miles, from Perth. In fact, what is happening is that one journey is travelling away from, and the other is travelling towards Perth. Again, the two journeys meet. This time it is miles from Perth.
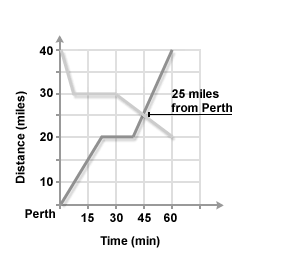
You will also see that the two journeys contain stops.
If we were to calculate the average speeds for each total journey we would have to include this time as well.
A graph showing a journey (or journeys) should have time on the horizontal axis, and distance from somewhere on the vertical axis.
A line moving up, as it goes from left to right, shows a journey moving away from a place, and a line moving down, as it goes from left to right, represents a journey towards a place.
A horizontal line is a break or rest.
Two lines, sloping the same way, cut: then an overtaking has taken place.
Two lines, sloping opposite ways, cut: a meeting has taken place.
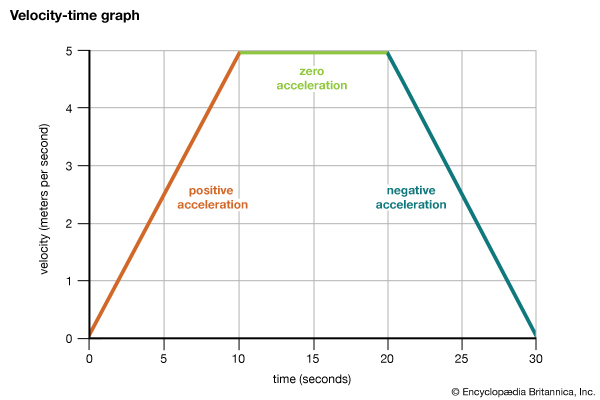
Speed-time graphs
A speed-time graph ( also called velocity-time graph), shows how the speed of an object varies with time during a journey.
There are two very important things to remember about velocity-time graphs.
The distance travelled is the area under the graph.
The gradient or slope of the graph is equal to the acceleration. If the gradient is negative, then there is a deceleration. We may use the equations(1) or some rearrangement of this equation.
WEEKEND ASSESSMENT
Example. A car starts on a journey. It accelerates for 10 seconds at It then travels at a constant speed for 50 seconds before coming to rest in a further 4 seconds.
- Sketch a velocity-time graph.
- Find the total distance travelled.
- Find the deceleration when the car is coming to a stop at the end.
- Find the average speed.
We have come to the end of this class. We do hope you enjoyed the class?
Should you have any further question, feel free to ask in the comment section below and trust us to respond as soon as possible.
In our next class, we will be talking about Plane Figures and Shapes. We are very much eager to meet you there.