Back to: MATHEMATICS JSS3
Welcome to Class !!
We are eager to have you join us !!
In today’s Mathematics class, We will be talking about Measure of Central Tendency. We hope you enjoy the class!
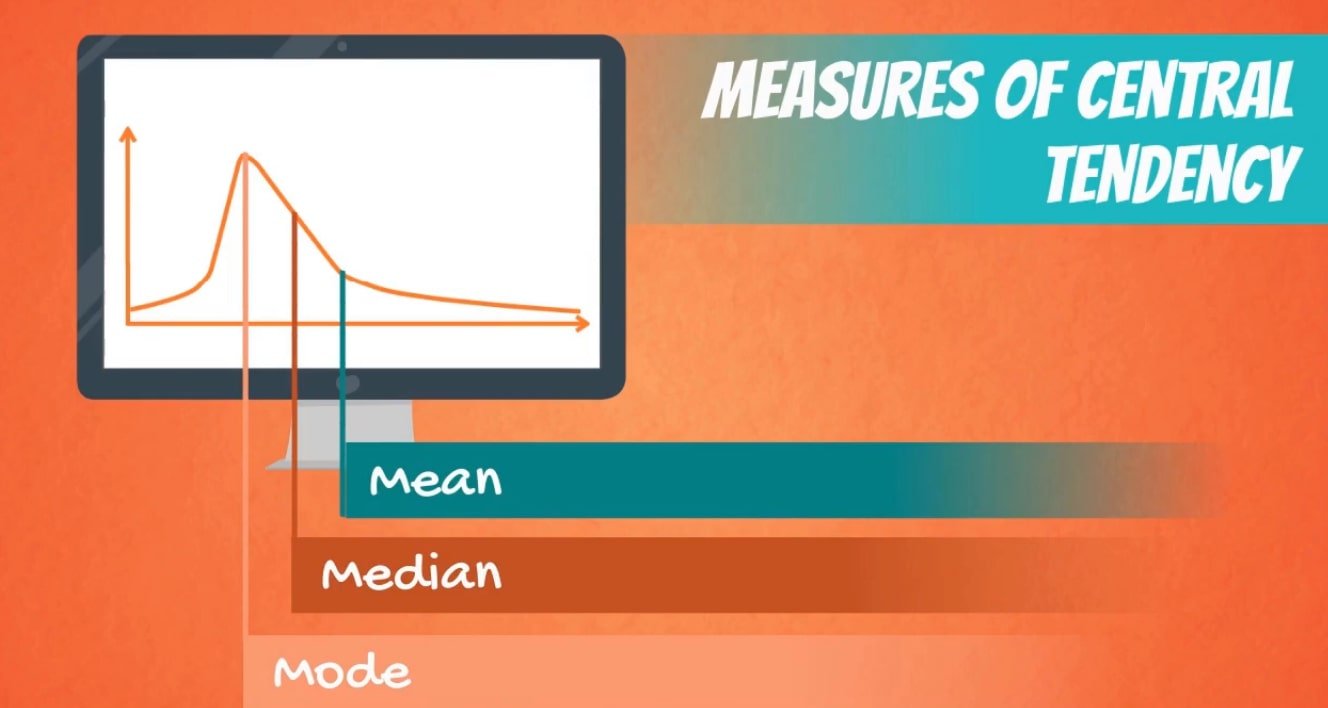
A measure of central tendency is a single value that attempts to describe a set of data by identifying the central position within that set of data. As such, measures of central tendency are sometimes called measures of central location. They are also classed as summary statistics. The mean (often called the average) is most likely the measure of central tendency that you are most familiar with, but there are others, such as the median and the mode.
The mean, median and mode are all valid measures of central tendency, but under different conditions, some measures of central tendency become more appropriate to use than others. In the following sections, we will look at the mean, mode and median, and learn how to calculate them and under what conditions they are most appropriate to be used.
Mean (Arithmetic)
The mean (or average) is the most popular and well-known measure of central tendency. It can be used with both discrete and continuous data, although its use is most often with continuous data. The mean is equal to the sum of all the values in the data set divided by the number of values in the data set. So, if we have n values in a data set and they have values x1, x2, …, xn, the sample mean, usually denoted by (pronounced x bar), is:
This formula is usually written in a slightly different manner using the Greek capital letter , pronounced “sigma”, which means “sum of…”:
You may have noticed that the above formula refers to the sample mean. So, why have we called it a sample mean? This is because, in statistics, samples and populations have very different meanings and these differences are very important, even if, in the case of the mean, they are calculated in the same way. To acknowledge that we are calculating the population mean and not the sample mean, we use the Greek lower case letter “mu”, denoted as µ:
The mean is essentially a model of your data set. It is the value that is most common. You will notice, however, that the mean is not often one of the actual values that you have observed in your data set. However, one of its important properties is that it minimizes error in the prediction of any one value in your data set. That is, it is the value that produces the lowest amount of error from all other values in the data set.
An important property of the mean is that it includes every value in your data set as part of the calculation. In addition, the mean is the only measure of central tendency where the sum of the deviations of each value from the mean is always zero.
When not to use the mean
The mean has one main disadvantage: it is particularly susceptible to the influence of outliers. These are values that are unusual compared to the rest of the data set by being especially small or large in numerical value. For example, consider the wages of staff at a factory below:
| Staff | 1 | 2 | 3 | 4 | 5 | 6 | 7 | 8 | 9 | 10 |
| Salary | 15k | 18k | 16k | 14k | 15k | 15k | 12k | 17k | 90k | 95k |
The mean salary for these ten staff is $30.7k. However, inspecting the raw data suggests that this mean value might not be the best way to accurately reflect the typical salary of a worker, as most workers have salaries in the $12k to 18k range. The mean is being skewed by the two large salaries. Therefore, in this situation, we would like to have a better measure of central tendency. As we will find out later, taking the median would be a better measure of central tendency in this situation.
Another time when we usually prefer the median over the mean (or mode) is when our data is skewed (i.e., the frequency distribution for our data is skewed). If we consider the normal distribution – as this is the most frequently assessed in statistics – when the data is perfectly normal, the mean, median and mode are identical. Moreover, they all represent the most typical value in the data set. However, as the data becomes skewed the mean loses its ability to provide the best central location for the data because the skewed data is dragging it away from the typical value. However, the median best retains this position and is not as strongly influenced by the skewed values. This is explained in more detail in the skewed distribution section later in this guide.
Median

The median is the middle score for a set of data that has been arranged in order of magnitude. The median is less affected by outliers and skewed data. In order to calculate the median, suppose we have the data below:
| 65 | 55 | 89 | 56 | 35 | 14 | 56 | 55 | 87 | 45 | 92 |
We first need to rearrange that data into the order of magnitude (smallest first):
| 14 | 35 | 45 | 55 | 55 | 56 | 56 | 65 | 87 | 89 | 92 |
Our median mark is the middle mark – in this case, 56 (highlighted in bold). It is the middle mark because there are 5 scores before it and 5 scores after it. This works fine when you have an odd number of scores, but what happens when you have an even number of scores? What if you had only 10 scores? Well, you simply have to take the middle two scores and average the result. So, if we look at the example below:
| 65 | 55 | 89 | 56 | 35 | 14 | 56 | 55 | 87 | 45 |
We again rearrange that data into the order of magnitude (smallest first):
| 14 | 35 | 45 | 55 | 55 | 56 | 56 | 65 | 87 | 89 | 92 |
Only now we have to take the 5th and 6th score in our data set and average them to get a median of 55.5.
Definition of Mode
A statistical term that refers to the most frequently occurring number found in a set of numbers. The mode is found by collecting and organizing the data in order to count the frequency of each result. The result with the highest occurrences is the mode of the set.
Other related terms include the mean, or the average of a set; and the median, or the middle value in a set.
For example, in the following list of numbers, 16 is the mode since it appears more times than any other number in the set:
3, 3, 6, 9, 16, 16, 16, 27, 27, 37, 48
A set of numbers can have more than one mode (this is known as bimodal) if there are multiple numbers that occur with equal frequency, and more times than the others in the set.
3, 3, 3, 9, 16, 16, 16, 27, 37, 48
In this example, both number 3 and the number 16 are modes. If no number in a set of numbers occurs more than once, that set has no mode:
3, 6, 9, 16, 27, 37, 48
Range
The range of a set of data is the difference between the highest and lowest values in the set.
Cheryl took 7 math tests in one marking period. What is the range of her test scores?
89, 73, 84, 91, 87, 77, 94
Solution
Ordering the test scores from least to greatest, we get:
73, 77, 84, 87, 89, 91, 94
highest – lowest = 94 – 73 = 21
The range of these test scores is 21 points.
Example
The Jaeger family drove through 6 mid-western states on their summer vacation. Gasoline prices varied from state to state. What is the range of gasoline prices?
$1.79, $1.61, $1.96, $2.09, $1.84, $1.75
Solution
Ordering the data from least to greatest, we get:
$1.61, $1.75, $1.79, $1.84, $1.96, $2.09
highest – lowest = $2.09 – $1.61 = $0.48
The range of gasoline prices is $0.48.
Summary
The range of a set of data is the difference between the highest and lowest values in the set. To find the range, first, order the data from least to greatest. Then subtract the smallest value from the largest value in the set.
EVALUATION
- Find the average range of the following percentages
84%, 56%, 72%, 64%, 33%, 49%.
- A marathon race was completed by 5 participants. What is the range of times given in hours given thus, 2.7 hr, 8.3 hr, 3.5 hr, 5.1 hr, 4.9 hr?
We have come to the end of this class. We do hope you enjoyed the class?
Should you have any further question, feel free to ask in the comment section below and trust us to respond as soon as possible.
In our next class, we will be talking about Variation. We are very much eager to meet you there.